Before You Read
Before you begin reading, turn to page 2 in your Historian's Guidebook to Civilization. At the top of the page, write "Geographer's Tools" in the Margin. On this page, you will need to record the following information while you read:
- The definition of the following words
- Cartographer
- Political Map
- Physical Map
- Thematic Map
- In complete sentences, explain the advantages of using a map or a globe.
- List the following pieces of a map, then write a description and draw a picture which will help you remember what they look like.
- Map Title
- Map Key
- Map Symbol
- Compass Rose
- Map Scale
Parts of a Map
Maps are an important tool for studying the use of space on Earth. mapmaking depends on surveying, or measuring and recording the features of Earth's surface. Until recently, this could be undertaken only on land or sea. Today, aerial photography and satellite imaging are the most popular ways to gather data.
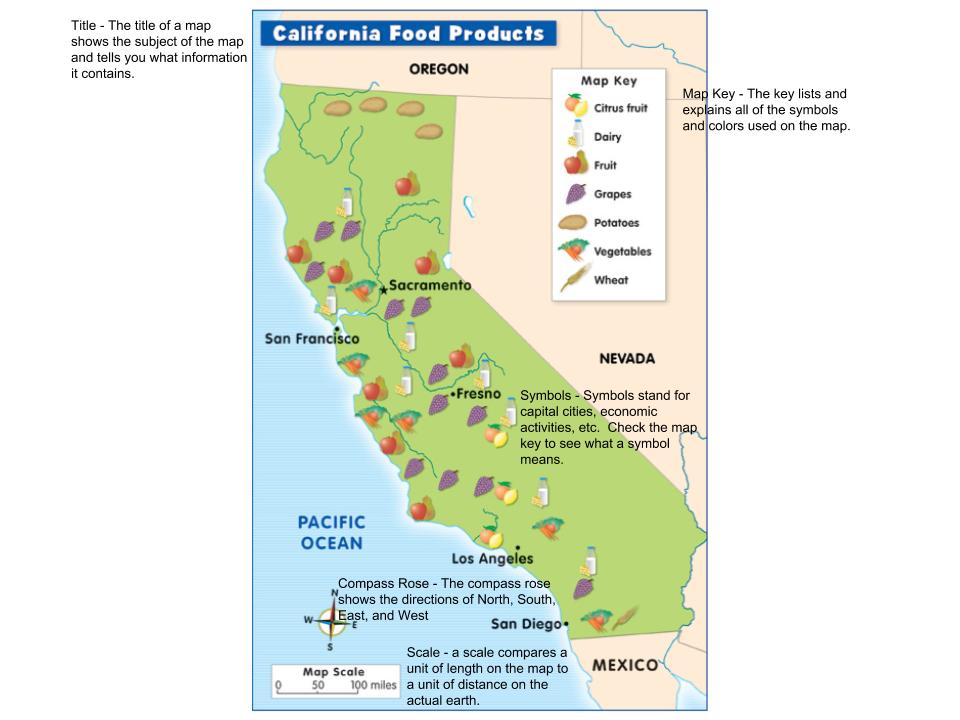
When looking at a map, there are several essential pieces which help the reader to learn more about an area. Look at the image below and read about the different parts of a map and what they are used for.
When looking at a map, there are several essential pieces which help the reader to learn more about an area. Look at the image below and read about the different parts of a map and what they are used for.
Maps and Globes
People have been drawing maps of their world for thousands of years. Geographers today have many tools, such as remote sensing and the Global Positioning System (GPS), to help them represent Earth. Increased knowledge and technology allows a cartographer, or mapmaker, to construct maps that give a much more detailed and accurate picture of the world.

|

|
Differences Between Maps and Globes
Both maps and globes represent Earth and its features. A globe is an accurate model of the world because it has three dimensions and can show its actual shape. Globes are difficult to carry around, however. Maps are more practical. They can be folded, carried, hung on a wall, or printed in a book or magazine. However, because maps show the world in only two dimensions, they are not perfectly accurate. Look at the pictures above to see why. When the orange peel is flattened out, the picture on the orange is distorted, or twisted out of shape. Cartographers have the same problem with maps.
Kinds of Maps
There are several kinds of maps which are used regularly by cartographers. Three of the most common types of maps are Political maps, Physical maps, and Thematic maps.

Political Maps show how people have divided up the planet into countries, states, cities, etc. Political maps usually include significant bodies of water as well. Colors are often used to separate different nations, states, etc.
Physical Maps describe what the surface of the Earth looks like. They do this by providing symbols or colors specifically to describe the Earth's natural features. This can include features like lakes, mountains, rivers, deserts, etc. Physical maps will often still include major political features, like the names of countries. 
Another thematic map showing the major languages spoken across Europe
|
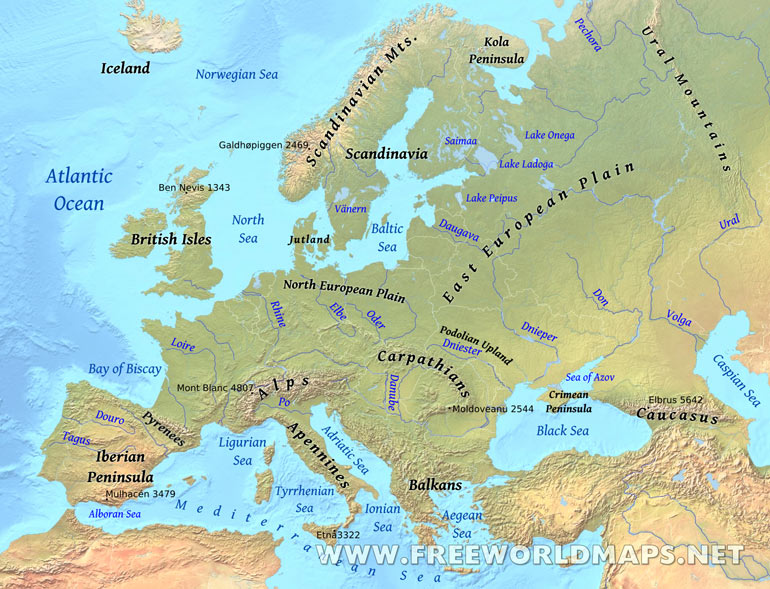
Physical Map of Europe
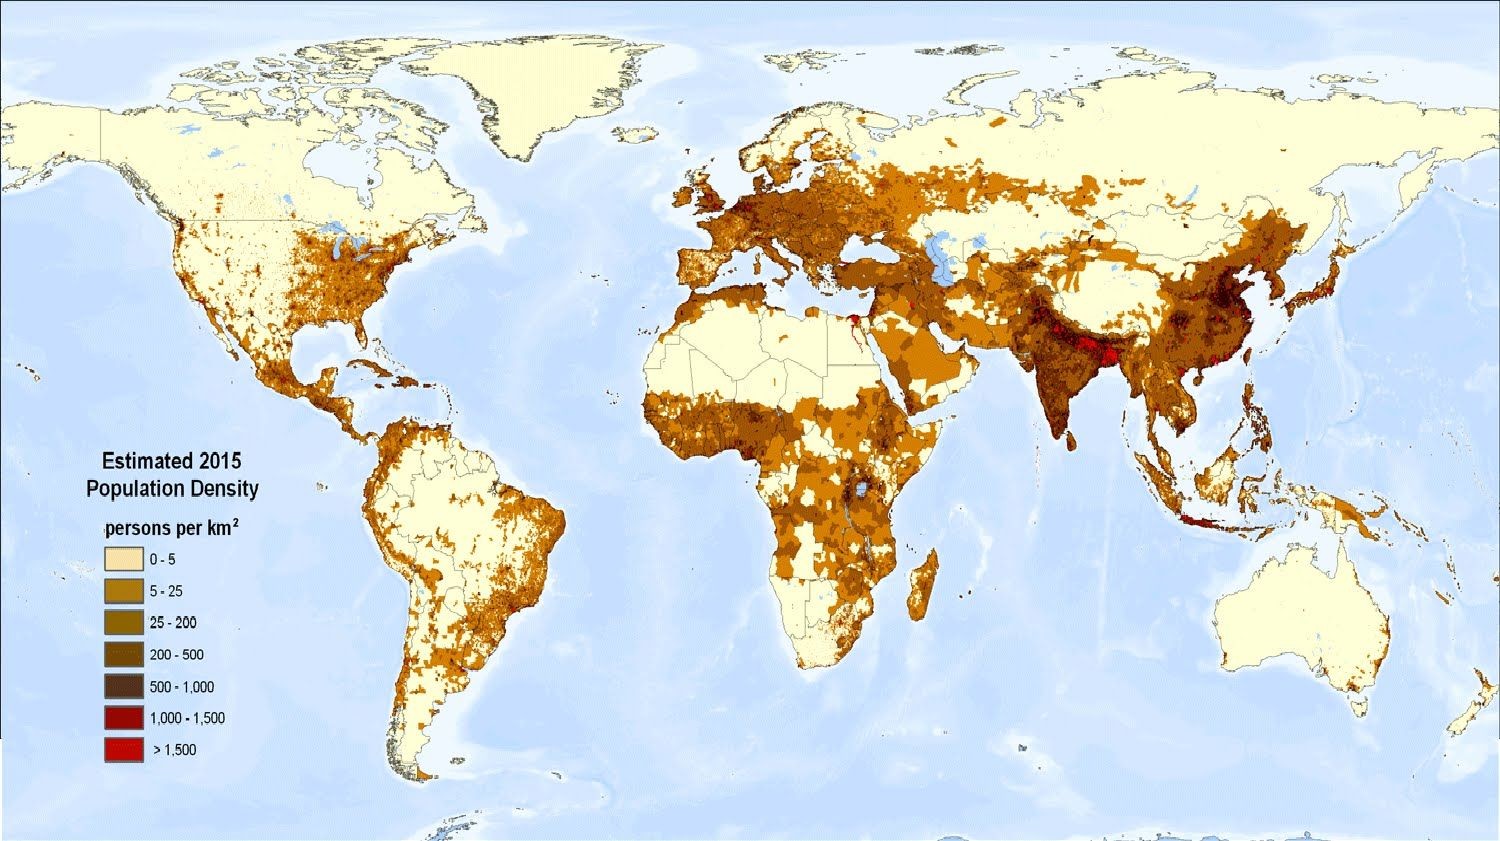
Thematic Maps are special maps that teach the reader a specific type of information. While Political maps focus on location and Physical maps focus on the features of an area, thematic maps focus on one specific theme. An excellent example of a Thematic map is a population map. By looking at the title and key of the map, it is clear that this thematic map is specifically used to teach the reader about the number of people in different parts of the world.
population map of Europe
|
Comparing Maps, Charts, and Graphs
Along with maps, geographers use charts and graphs to display and compare information. The graphs, charts, and maps below all contain information about the world's population. Notice how each quickly and clearly presents facts that would otherwise take up many paragraphs of text.
Thematic Map: World Population Map, 2015
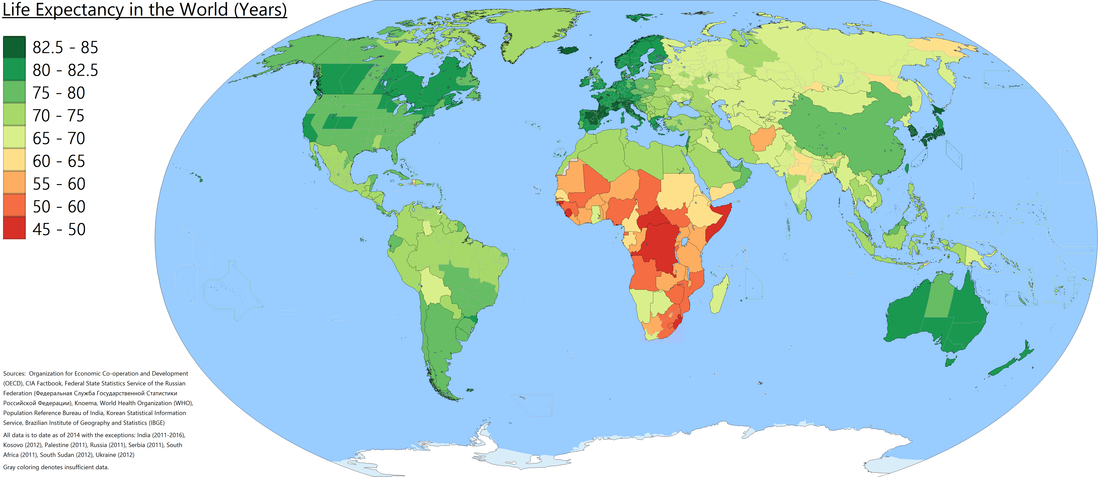
Thematic Map: Life Expectancy, 2014

Look at the chart above as it changes. What happens to the population of Earth as the chart moves farther forward in time? Which continents seem like they are gaining the most people? Which areas seem like they are growing more slowly?
|
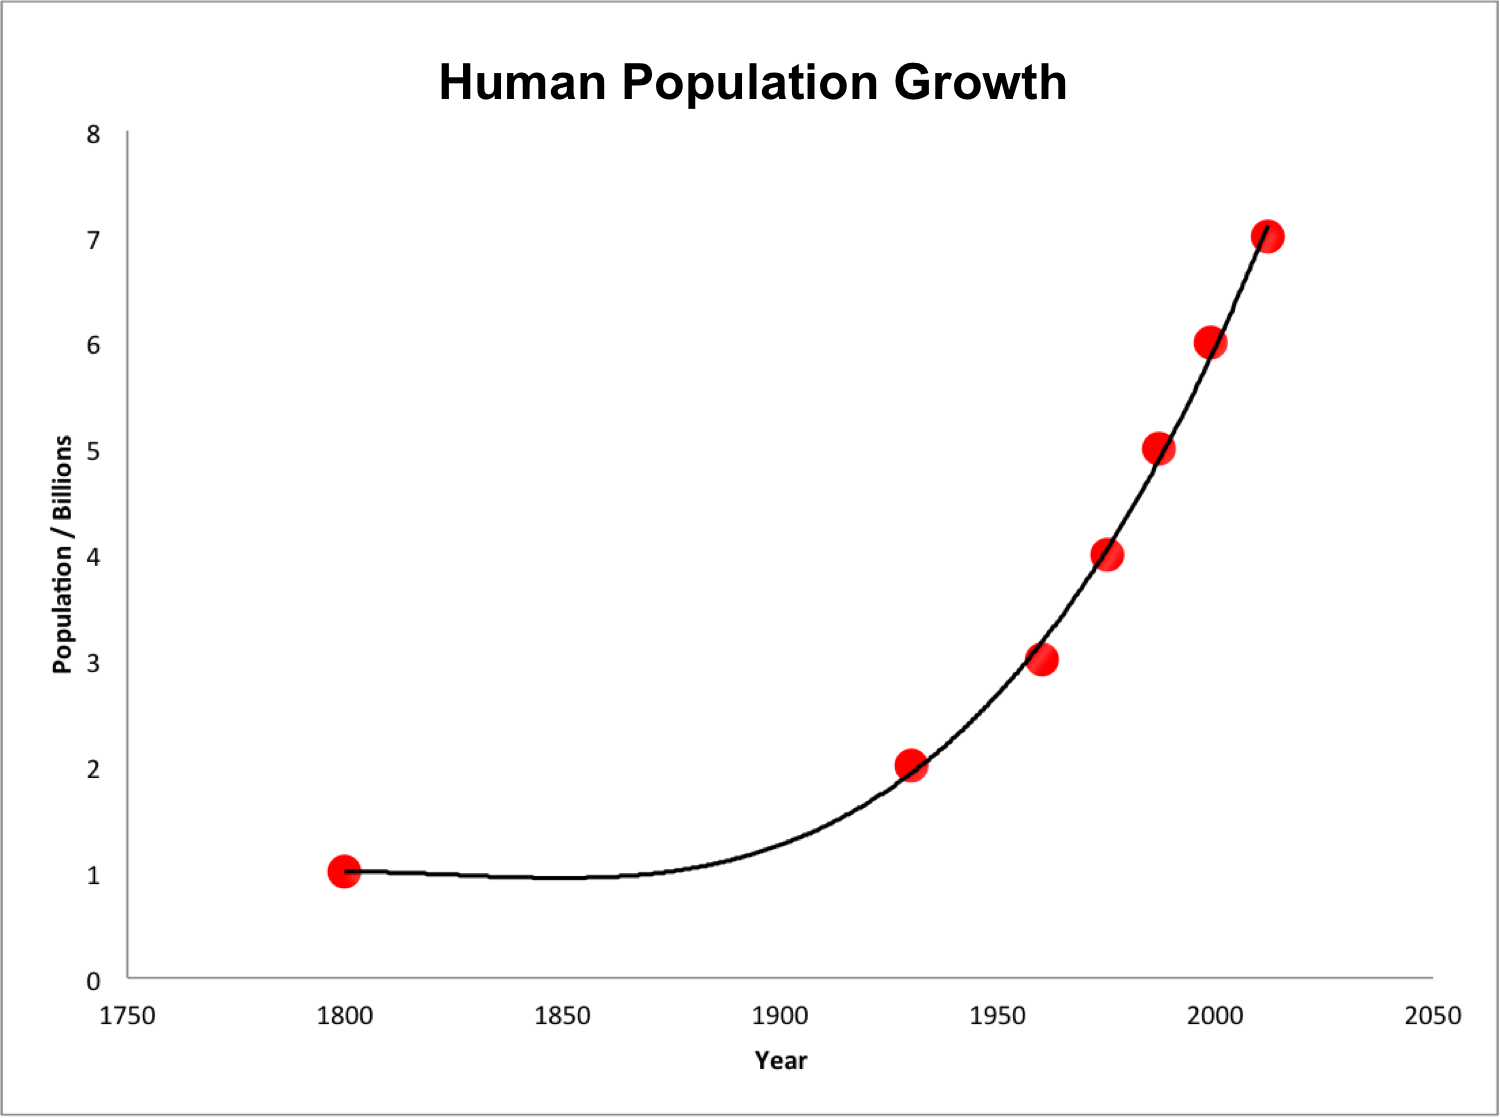
According to the graph above, the population of Earth is not shrinking. If the total population is not shrinking, why are continents like Europe, Latin America, and North America showing a smaller percentage of the total population?
|
click the black button labeled Assignment above. Fill out the google form to demonstrate your knowledge of a Geographer's tools. All information needed for your the assessment should be written in your guidebook.
